Everyone’s looking for a “good deal”. But how do you measure it? How do you measure a “good deal”? Is it by net sales? Profits? The traffic it brings to your website?
One common metric or “KPI” is conversion rate. A conversion rate, by definition, is the percentage of users who take action on your website. In our case (e-commerce), it refers to the rate of people who purchased a product. So, if 100 people looked at a couch and one person bought it, the conversion rate is 1 %.
It’s pretty straightforward – when the deal is right, due to price or demand, more people will purchase it. Some products have higher conversion rates than others. Many factors affect this outcome, such as awareness, brand affinity, popularity, price, shipping options, visual appeal, etc.
Generally speaking, conversion rates are used to see which specific deals are doing well (in terms of sales, traffic etc.) and which aren’t; which ones to promote, and which ones to improve or remove from your website. But if you have 100’s, even 1000’s of products on your website, things can get a little trickier.
For example, cheap products tend to have higher conversions than expensive ones. In fact, cups are purchased more frequently than sofas. But from a company standpoint, is selling cups more lucrative than selling sofas? Is the ROI of cups greater than that of sofas?
Take another example – dog treats! Very few people search for dog treats online, but when they do, the conversion rate is likely to be high. Does this make dog treats a “good deal”?
Sometimes, differentiating between a “good” deal and a “bad” deal is difficult. For this reason, we want to give you some practical tips to accurately measure conversations. And with this, you’ll be able to determine which deals need your attention and which don’t.
Keep it Narrow
Not all conversation rates are comparable. Expensive products have a much lower conversion rate than cheaper products. If your website sells both, you need to evaluate which ones drive more sales within the same category.
For example, a home design shop, like Zara Home, sells beds as well as pillows, in which case, pillows are likely to outsell beds with a 10X higher conversion rate. In other words, for every 10 people who buy a pillow, only 1 buys a bed.
To avoid such confusion, or an irrelevant comparison, keep your measurements separated. Measure conversions for both categories separately. Using this approach will inform you of the most popular item, be it a bed or a pillow, in its own specific category. Apples to apples.
Filter the Noise
Get ready, you will encounter a lot of noise when analyzing your top conversion data. Although many of your top-converting deals will appear as “good deals”, they could potentially be a curse in disguise. You want to avoid promoting them to every individual or giving them too much attention.
This can happen. A product may receive very little views, yet generate high % of purchases. For example, this could happen with a non-prescription drug, unique in its category. When people search for a product that has no other alternative, the conversion rate is going to be high. But if you market this product to your entire website user base, expect to be disappointed.
A good way to filter this noise is by limiting your data to a minimum number of views and/or purchases (per deal). Depending on your traffic or sales volume, your data could be filtered as to show only “real” high converting deals. For example: set your filters for minimum 200 views or 4 purchases per deals, in the last week/month. Play around with these figures until the data results make sense to you.
Lookout for Trends
A conversion rate is always relative to a specific time period. Your highest converting deals this week are going to be different from those of the last two weeks and last year. For example, perhaps this week your highest converting deal is a backpack, however, your highest converting deal this year was actually the fidget spinner. The more you widen the time frame, the more likely you are to pick up on “all-time best deals”.
However, the shorter the time frame, the more likely you are to pick up on recent market trends and seasonality. Always remember to keep it fresh whenever preparing your campaigns or newsletters. In order to get a good idea of things, we recommend to look at three different time frames, for example, performance last month, last two weeks, and the last 72 hours. In this manner, you can identify top converting deals and recently trending products.
In addition, picking up on recent trends is an integral part of your customer relationship management marketing strategy (CRM marketing). As you become more aware of your customers’ purchase behaviours, it helps you better cater their needs. For example, on a yearly basis, laptops have a low conversion rate. However, it peaks moderately during mid-August, as students prepare for their autumn semester. Being able to spot this trend allows you to prepare and promote your deals when relevant to your customers, reinforcing your CRM marketing strategy.
As far as conversations go, now you’re a little wiser… So what’s next? How about low converting deals? Should you get rid of them or let them be? Here’s an extra tip, a tool to help you decide what to do next:
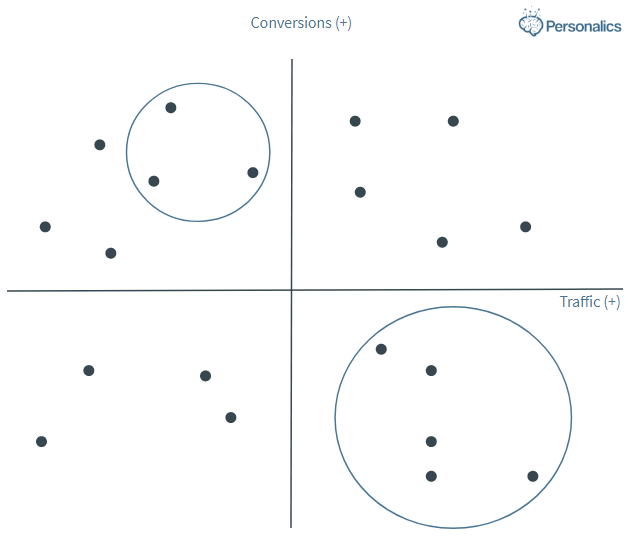
- Top right, high conversions, high traffic deals. These are your “cash cows”.
- Top left, high conversions, low traffic. Consider driving more traffic to these deals.
- Bottom Left, low conversions low traffic. No harm done! You can leave them be.
- Bottom right, low conversions high traffic. Consider getting rid of…!
This post was written by Itai Eshkar, a Marketing Manager at Personalics